Response of Cotton Varieties to Target Spot During 2018: Lucedale and Stoneville Evaluations
Related Articles
- Rice Variety Trial Results For 2010, Plus Rice Research Report 0
- Evaluation of Peanut Prescription Rx Program in Mississippi 0
- Fertilizing Cotton with Poultry Litter 5
Latest Tweets

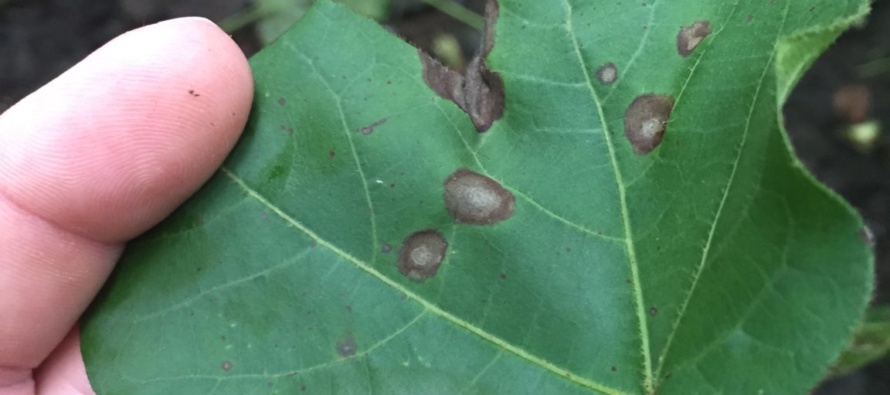
Target spot of cotton. Note defined lesions with concentric rings.
During 2018, the cotton OVT (official variety trial) at Lucedale and Stoneville was evaluated for the response to target spot. Natural infection occurred during the season and plots were evaluated for the presence (incidence), severity and defoliation as a result of target spot. Evaluations were made a single time at each location in an attempt to determine the differences between varieties at each location. Target spot was evaluated by observing the level of disease within each of the plots (incidence) as well as the percentage of the leaf surface area of those leaves exhibiting disease (severity). In addition to observations of the incidence and severity of target spot, the percent defoliation in each of the plots was assessed at the time of evaluations. One additional evaluation was made from each plot to consider the number of bolls on the ground (or boll shed) as a result of target spot. Even though boll shed has not been formally described as a symptom associated with target spot, anecdotally numerous individuals have reported boll shed occurs as a result of the disease. Those data as they relate to boll shed are not included in the attached tables because no boll shed was observed in the plots evaluated as a whole.
Other states that are making observations on target spot incidence and severity between varieties have indicated that variety response may differ between locations. Considering the two locations evaluated during 2018 there appear to be differences between varieties if you consider the greatest and least amount of defoliation as well as incidence and severity of disease. The varieties also differed in those entries that produced the lowest and greatest yield. These types of data suggest there may be differences between the micro-environment at locations that experience severe target spot as well as possible differences in the fungal population present that may relate to disease incidence and severity. Additional observations are warranted over multiple seasons to create a list of susceptible and resistant varieties.
2018 Lucedale target spot evaluations
2018 Stoneville target spot evaluation
Defoliation as a result of target spot

Defoliation categories as created based on the Lucedale OVT data. Bold numbers on each bar indicate the number of varieties within a given category. The minimum and maximum yield values for the varieties within each category are at the top of the figure in the table.
In general, disease severity was lower in 2018 (4 – 13.8) at the two locations than observed in 2017 (1.5 – 23.8) suggesting a different environment between the two seasons. Similar to the 2017 data from Lucedale (https://www.mississippi-crops.com/2018/01/27/cotton-target-spot-2017-lucedale-ovt-disease-rating-results/), one way to look at these data was to create defoliation categories, to present the frequency of varieties within each category based on percent defoliation. To this end, seven defoliation categories were derived based on a compilation of all of the data from the two locations (0-10, 10-20, 20+30, 30-40, 40-50, 50-60, 60+). Essentially, comparing the entries within each assigned category with regards to yield could provide information as to the amounts of percent defoliation necessary for yield reductions to occur as a result of target spot. By grouping varieties within classes, based on ranges of defoliation, one would hope to gather some valuable information regarding the response of varieties that were observed to perform in a similar fashion. Based on defoliation averages from 2018 (from all four plots of a given variety) the lowest percent defoliation observed was 10%, while the greatest observed was 65%. As compared to the 2017 season, a greater level of defoliation was observed, but this could be due to evaluations collected at different times or environmental differences between seasons, which is more likely the case since target spot throughout the majority of Mississippi could be considered to have been lighter during 2018 than 2017. The average of all varieties (from both locations, n=57 entries ×2 locations = 114 total entries) was 44.2%. However, take the information in the associated figure with a grain of salt. In some cases, the range of yield between varieties in the assigned classes is quite large. The minimum and maximum yield for the varieties in each classification are presented in the table at the top of the figure. Based on these data (one year, two locations) it is difficult to make assumptions with a limited number of observations (locations), in this case varieties (or locations), within a given classification. The number of varieties within each defoliation category are included as the bold number on each bar. However, if yield can be related to defoliation based on these classifications it appears that some varieties may be more able to tolerate the disease than others. But, with all of that said, more observations are necessary to determine the differences between target spot susceptible and target spot resistant varieties.


Let me tell You a sad story ! There are no comments yet, but You can be first one to comment this article.
Write a comment