Furrow Irrigation Rice Yield Variations
Related Articles
- Rice Variety Trial Results For 2010, Plus Rice Research Report 0
- Rice Seeding Rate Calculator and Chart 0
- 2011 Rice Burndown Considerations 0
Latest Tweets
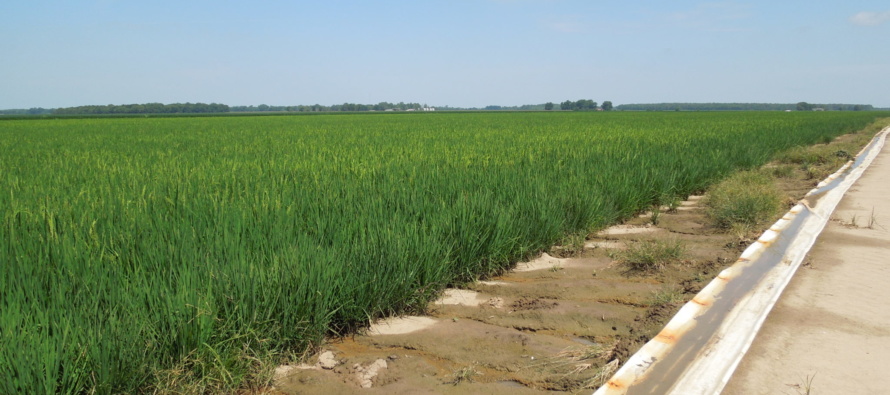
If you ask experienced furrow irrigated rice producers one thing is clear, they recognize only a small, if any, yield reduction. MSU Researchers, recognizing the significant yield reduction observed in small plot data compared to producer experience, began looking deeper into the on farm data for answers.The two year furrow irrigated rice small plot data suggest that a continuous flood irrigation and an optimized AWD (allowing the flood to recede to 4″ below the soil surface while maintaining flood water on the bottom side of the plots) irrigation yield substantially better than allowing the soil to become dry. When you think about what actually happens on the farm, each field of furrow irrigated rice is actually three sub fields. As demonstrated by the example, the top one third is the driest, the middle is similar to the optimized AWD treatments (soupy wet but never dry), and the bottom one third resembles a continuous irrigated field.
 Here is an adjacent conventional levee yield map compared to the row rice field. In this comparison, the whole field average of the row rice field was equal to the conventional levee field. The adjacent conventional levee field was on .20 grade with levees every 100′, contributing to a lower field average. Fields with grades greater than .20 can be a good fit for row rice.
 In 2018 we processed yield map data from the last couple of years by dividing the row rice fields into three equal sections. Yields from the top, middle, and bottom were processed and entered into an spreadsheet. Remember that the top one third is the driest, the middle is similar to the optimized AWD treatments (soupy wet but never dry), and the bottom one third resembles a continuous irrigated field. Presented above is the yield comparison. These data indicate that the yield drag of row rice may be managed by irrigating the field more often but for less time. This year we are evaluating sensors to assist in our irrigation management decisions. These data also continue to support the 5-8 bushel yield difference between row rice and conventional rice production.


Let me tell You a sad story ! There are no comments yet, but You can be first one to comment this article.
Write a comment