
Economics of Grain Delivery Decisions

Related Articles
- 2010 Soybean And Corn Variety Trial Data 3
- Bayer CropScience-O.A. Cleveland Weekly Cotton Commentary 0
- 2010 Row Crop Short Course Video Links 0
Latest Tweets
When choosing where to deliver grain, producers often focus first on the posted price. However, the highest posted price may not always result in the highest net return. Grain moisture, buyer discounts, delivery distance, fuel costs, labor, and wait times can all affect the final value of a load. This article discusses the impact of these decisions on the final price and presents a new decision-making tool available to producers.
The decision tool can be accessed at: Grain Delivery Tool.
Grain Moisture
Most corn and soybean buyers use a standard moisture level when purchasing grain. Corn is commonly priced at 15 percent moisture, while soybeans are typically priced at 13 percent moisture. Grain delivered above the standard moisture level is generally subject to a discount because wetter grain contains more water and less marketable dry matter. However, delivering grain below the standard can also reduce producer returns because the additional dry matter is typically sold without receiving a premium or an adjustment in the number of bushels delivered.
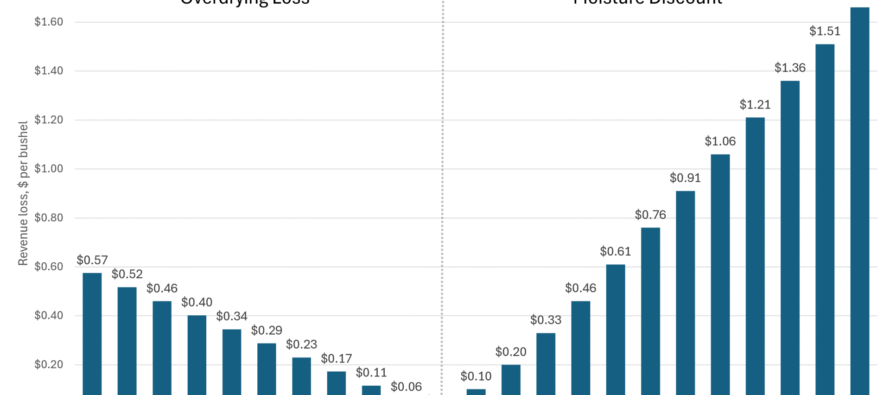
The figure below illustrates the effect of corn moisture on revenue using an assumed moisture discount schedule and a base price of $4.00 per bushel. At 16 percent moisture, the producer would incur an estimated moisture discount of approximately 8 cents per bushel, reducing the effective price to $3.92 per bushel. As moisture increases, the discount becomes larger. At 22 percent moisture, the estimated discount increases to approximately 62 cents per bushel, reducing the effective price to $3.38 per bushel.
Moisture levels below 15 percent also affect revenue, although the loss does not appear as a direct discount to the producer. In this example, delivering corn at 14 percent moisture instead of 15 percent results in an estimated loss of approximately 5 cents per bushel. Lower-moisture corn contains more dry matter per delivered bushel, but the producer is still paid based on the same standard bushel weight. Therefore, the additional dry matter is delivered without additional compensation.
The second figure presents the same relationship for soybeans using a standard moisture level of 13 percent and an assumed soybean price of $10.00 per bushel. At 14 percent moisture, the estimated revenue loss is approximately 20 cents per bushel. The loss increases to approximately 46 cents per bushel at 15 percent moisture and 76 cents per bushel at 16 percent moisture. At 18 percent moisture, the estimated loss reaches approximately $1.36 per bushel, demonstrating the substantial effect that moisture discounts can have on soybean revenue.
It is also important to note that when moisture discounts are calculated as a percentage of the grain’s price, the dollar value of the discount increases as grain prices rise. Therefore, the revenue losses shown in Figures 1 and 2 would be larger at higher corn or soybean prices and smaller at lower prices, even if the percentage discount schedule remained unchanged.


Distance and Wait Times
Delivery distance and elevator wait time can also affect which grain buyer provides the highest net return. Table 1 compares three delivery scenarios that differ by distance and unloading time. As expected, total delivery cost increases as distance increases. In this example, Buyer 1 is located 20 miles away, while Buyer 3 is 30 miles away. Delivering to Buyer 3 costs approximately 6.5 cents more per bushel than delivering to Buyer 1, reducing the price after delivery costs from $4.36 to $4.29 per bushel.
Buyer 1 has the longest wait and unload time at 30 minutes, compared with 10 minutes for Buyer 3. However, the additional labor cost associated with the longer wait is smaller than the increase in fuel and truck overhead costs associated with traveling the additional distance. Buyer 1 has an estimated labor cost of 1.83 cents per bushel, while Buyer 3 has a slightly higher labor cost of 1.97 cents per bushel because of the longer travel time.
These results suggest that distance is the primary driver of delivery cost in this example. However, wait time still matters, especially during harvest when delays can reduce the number of loads moved in a day. Producers should consider the total time required for each delivery, including both travel and unloading, rather than focusing on either factor alone.

Decision Tool
To help producers evaluate these tradeoffs, faculty in the Mississippi State University Department of Agricultural Economics developed a decision tool that compares potential grain delivery points. Producers can enter buyer-specific moisture discount schedules, posted prices, travel distances, elevator wait times, and transportation costs. The tool then estimates the net price for each delivery option and identifies the buyer who provides the highest expected return under the selected assumptions.
Because prices, discounts, and delivery conditions can vary among buyers and change throughout the harvest, the tool is intended to support individual decisions rather than provide a single recommendation for all farms. The tool can be accessed at: msstateagecon.shinyapps.io/GrainDeliveryApp/.
This work is supported by the Mississippi Corn Promotion Board.




Let me tell You a sad story ! There are no comments yet, but You can be first one to comment this article.
Write a comment